Requisitos de finalización
Ver
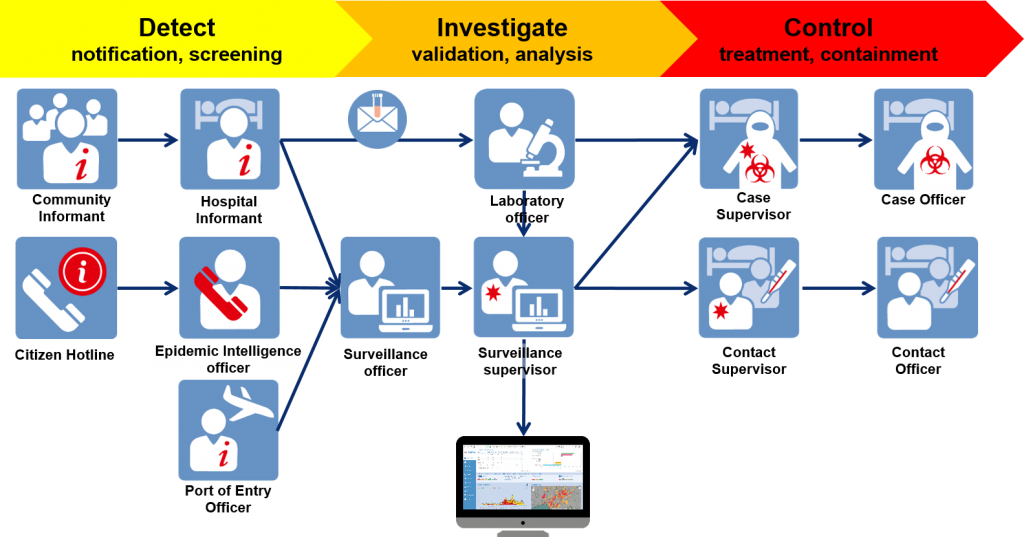
SORMAS is built to ensure data privacy and security, with different user roles and permissions to protect sensitive information. It also facilitates seamless communication and coordination among different public health institutes, such as hospitals, labs, and surveillance officers, streamlining workflows and enhancing collaboration.
- **As a Case**: Imagine Ada gets sick with something like COVID-19. In SORMAS, we call this a ‘case situation.’ It’s a way to keep track of her illness details—like symptoms or hospital stays.
- **Ada's friends and family are Contacts**: If Ada was physically close to anyone we refer to them as a ‘contact.’ There’s a follow-up task and process to observe if the contacts stay healthy, which involves checking in on them regularly.
- **As an Event Participant**: Suppose, before she was very sick, Ada went to a concert where there was a risk of illness spread. SORMAS can be used to track everyone who attended, creating an ‘event situation’ to monitor potential health risks.
In SORMAS, Ada has one profile linking all these situations. Also, for each of these situations, we can create ‘tasks’ to manage what health workers need to do, like visiting Ada or sending her for a test. And if Ada gives a sample, like a throat swab, this is stored with her case, contact, or event details.
The beauty of SORMAS is that it connects all the dots. If Ada’s sample results in a positive test, the system updates her status and informs the health workers what to do next. It’s all about keeping track and staying ahead of health risks, making sure we’re prepared to act fast. Think of SORMAS like a smart digital assistant, helping us manage health information efficiently and effectively, so we can keep people safe and healthy. How amazing is that?
In many countries, laboratories, hospitals, medical offices, airport physicians, ministries and public health departments work together via SORMAS. For more than 40 diseases, SORMAS enables digital data exchange in real time, even horizontally across national or regional borders. SORMAS is one of the world’s leading systems in this field, with the broadest range of functions and has been declared as a “Global Good” by UNICEF. Please read more on the SORMAS Website.
The SORMAS Academy supports local, national and international organizations in the development and implementation of SORMAS and other digital open source systems for disease prevention and mitigation.
In summary, SORMAS is a tool for keeping track of things like disease cases, contacts, and samples, such as those for COVID-19. This tool is more than just for recording data; it lets people do things with the information, like assigning specific jobs to handle outbreaks.
The main screen of SORMAS shows an easy-to-understand view of diseases, cases, and other details, with charts and maps. People can work with this data, change how it looks, and get the information out of the system. It's especially good at analyzing and showing data to help control disease spread and track who's been in contact with whom.
Última modificación: lunes, 29 de abril de 2024, 17:25